Machine Vision
OpenCV Image Similarity Comparison with Python
Learn how to leverage the power of OpenCV in Python to compare the similarity between images for tasks like duplicate detection or image search.
Learn how to leverage the power of OpenCV in Python to compare the similarity between images for tasks like duplicate detection or image search.

Image similarity comparison is a fundamental task in computer vision, often used in various applications like object recognition, image retrieval, and quality assessment. This article provides a step-by-step guide on how to compare the similarity between two images using Python and OpenCV. We will explore two common metrics: Mean Squared Error (MSE) and Structural Similarity Index (SSIM). We will start by loading the necessary libraries and images, then delve into the calculation and interpretation of each metric. Additionally, we will cover optional steps for visualizing the differences between the images.
import cv2
import numpy as npimage1 = cv2.imread('image1.jpg')
image2 = cv2.imread('image2.jpg')gray1 = cv2.cvtColor(image1, cv2.COLOR_BGR2GRAY)
gray2 = cv2.cvtColor(image2, cv2.COLOR_BGR2GRAY)error = np.sum((gray1.astype("float") - gray2.astype("float")) ** 2)
error /= float(gray1.shape[0] * gray1.shape[1])Interpret MSE:
(Optional) Calculate Structural Similarity Index (SSIM):
(score, diff) = cv2.compareSSIM(gray1, gray2, full=True)
diff = (diff * 255).astype("uint8")Interpret SSIM:
(Optional) Visualize differences:
thresh = cv2.threshold(diff, 0, 255, cv2.THRESH_BINARY_INV | cv2.THRESH_OTSU)[1]print("MSE:", error)
print("SSIM:", score)
cv2.imshow("Diff", diff)
cv2.waitKey(0)The Python code compares the similarity between two images using Mean Squared Error (MSE) and Structural Similarity Index (SSIM). It loads the images, converts them to grayscale, calculates MSE and SSIM, and visualizes the differences. Lower MSE and higher SSIM values indicate greater similarity. The code displays the original images, a difference map, and a thresholded difference map to highlight areas of dissimilarity.
import cv2
import numpy as np
# Load the images
image1 = cv2.imread('image1.jpg')
image2 = cv2.imread('image2.jpg')
# Convert images to grayscale
gray1 = cv2.cvtColor(image1, cv2.COLOR_BGR2GRAY)
gray2 = cv2.cvtColor(image2, cv2.COLOR_BGR2GRAY)
# Calculate Mean Squared Error (MSE)
error = np.sum((gray1.astype("float") - gray2.astype("float")) ** 2)
error /= float(gray1.shape[0] * gray1.shape[1])
# Interpret MSE
print("MSE:", error) # Lower values indicate higher similarity
# Calculate Structural Similarity Index (SSIM)
(score, diff) = cv2.compareSSIM(gray1, gray2, full=True)
diff = (diff * 255).astype("uint8")
# Interpret SSIM
print("SSIM:", score) # Values closer to 1 indicate higher similarity
# Visualize differences
thresh = cv2.threshold(diff, 0, 255, cv2.THRESH_BINARY_INV | cv2.THRESH_OTSU)[1]
# Display results
cv2.imshow("Image 1", image1)
cv2.imshow("Image 2", image2)
cv2.imshow("Diff", diff)
cv2.imshow("Thresh", thresh)
cv2.waitKey(0)Explanation:
cv2 for image processing and numpy for numerical operations.cv2.imread().cv2.cvtColor(). This is often necessary for accurate similarity comparisons.cv2.compareSSIM(). SSIM is a more advanced metric that considers structural information in the images.diff output from cv2.compareSSIM() by 255 and convert it to an 8-bit unsigned integer to visualize the differences.cv2.threshold() to highlight the most significant differences.diff), and the thresholded difference map (thresh) using cv2.imshow().To use this code:
'image1.jpg' and 'image2.jpg' with the actual file names of your images.General Considerations:
MSE:
SSIM:
Visualizing Differences:
cv2.findContours()) on the difference map to highlight regions of dissimilarity.Applications:
Beyond MSE and SSIM:
This code snippet demonstrates how to compare the similarity between two images using Python and the OpenCV library.
Steps:
cv2.imread().cv2.cvtColor() for efficient comparison.Key Takeaways:
This code provides a basic framework for image similarity comparison. You can adapt and extend it for various applications like image search, object tracking, and change detection.
This article explored image similarity comparison using Python and OpenCV, focusing on MSE and SSIM metrics. We learned to calculate these metrics, interpret their results, and visualize differences between images. While MSE offers a simple difference measure, SSIM provides a perceptually aligned approach by considering structural information. Choosing the appropriate metric depends on the specific application requirements. This guide serves as a starting point for incorporating image similarity comparison into various computer vision tasks. Remember to consider image preprocessing, explore color-based metrics when needed, and investigate advanced techniques like feature-based comparison or deep learning for more complex scenarios.
 Using OpenCV for Image Similarity - Python - OpenCV | I’m trying to compare two images and return a score based on how similar the second image is to the original. So, I watched several videos on how to do this, but nothing seems to return the correct answer because the closer the second image to the first one is, the lower the score gets. My idea is to have image 1 as the original image that will be used to compare the other images with. For example, images 2-4 are just for testing. The idea is to have a final image similar to image 4 that loo...
 Detect and visualize differences between two images with OpenCV ... | May 17, 2019 ... The SSIM score after comparing the two images show that they are very similar. Image Similarity: 91.9887%. Now we filter through the diff image ...
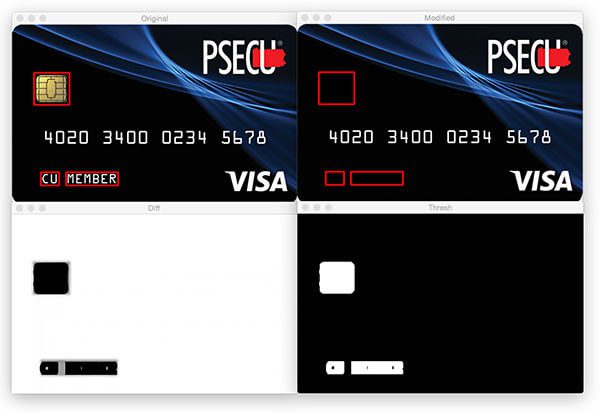 Image Difference with OpenCV and Python - PyImageSearch | Learn how to compare two images by computing image differences and highlighting the differences between the images using OpenCV and Python. opencv - Calculate similarity of picture and its sketch - Stack Overflow | Feb 17, 2017 ... Compare similarity of images using OpenCV with Python · 8 · Compare the ... Comparing image similarity using OpenCV in Java · 1 · Compute ...
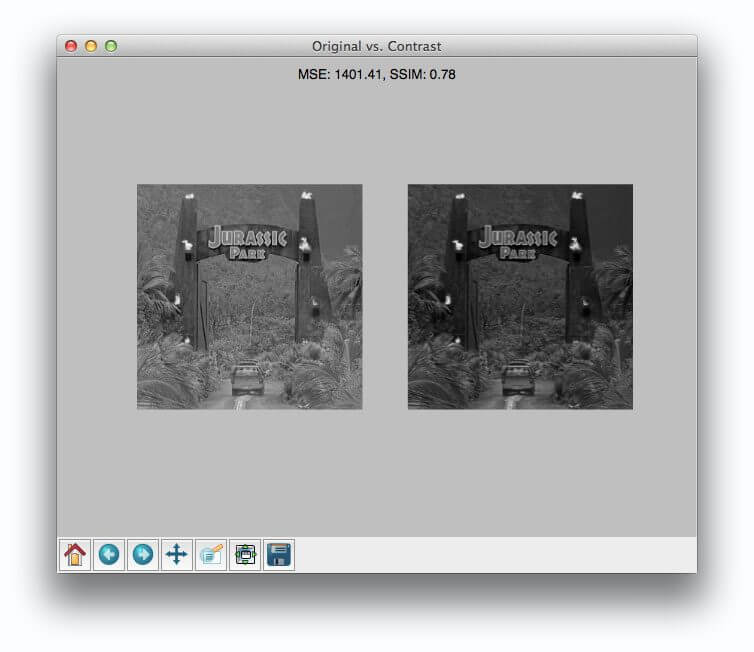 How-To: Python Compare Two Images - PyImageSearch | Learn how to compare two images for similarity using Mean Squared Error and Structural Similarity Index (SSIM) with Python. Code included.
 Measure similarity between images using Python-OpenCV ... | A Computer Science portal for geeks. It contains well written, well thought and well explained computer science and programming articles, quizzes and practice/competitive programming/company interview Questions.
 Exploring Image Similarity Approaches in Python | by Vasista Reddy ... | In a world inundated with images, the ability to measure and quantify the similarity between images has become a critical task. Whether…