Machine Vision
mAP Metric Explained: Calculation and Understanding
This article explains the mAP (mean Average Precision) metric, a popular evaluation metric used in object detection, and provides a detailed breakdown of its calculation.
This article explains the mAP (mean Average Precision) metric, a popular evaluation metric used in object detection, and provides a detailed breakdown of its calculation.

Mean Average Precision (mAP) is a common metric for evaluating the performance of object detection models. It provides a comprehensive assessment of how well a model locates and classifies objects within images. This introduction will guide you through the key concepts and steps involved in calculating mAP.
iou = intersection_area / union_areaprecision = true_positives / (true_positives + false_positives)recall = true_positives / (true_positives + false_negatives)mAP = (AP_class1 + AP_class2 + ... + AP_classN) / NThis Python code defines two functions: calculate_iou and calculate_map. calculate_iou computes the Intersection over Union (IoU) between two bounding boxes, each represented by its coordinates. calculate_map calculates the mean Average Precision (mAP) for object detection tasks. It takes ground truth and prediction data as input, along with an optional IoU threshold. The code iterates through each class, determines true positives based on IoU, and computes the average precision for each class using scikit-learn's average_precision_score. Finally, it calculates the mAP by averaging the AP values across all classes. An example usage demonstrates how to use these functions with sample data.
import numpy as np
from sklearn.metrics import average_precision_score, precision_recall_curve

def calculate_iou(box1, box2):
  """Calculates the Intersection over Union (IoU) between two bounding boxes.

  Args:
    box1: [x_min, y_min, x_max, y_max] coordinates of the first box.
    box2: [x_min, y_min, x_max, y_max] coordinates of the second box.

  Returns:
    iou: The IoU value, a float between 0 and 1.
  """
  x_left = max(box1[0], box2[0])
  y_top = max(box1[1], box2[1])
  x_right = min(box1[2], box2[2])
  y_bottom = min(box1[3], box2[3])

  intersection_area = max(0, x_right - x_left) * max(0, y_bottom - y_top)
  box1_area = (box1[2] - box1[0]) * (box1[3] - box1[1])
  box2_area = (box2[2] - box2[0]) * (box2[3] - box2[1])
  union_area = box1_area + box2_area - intersection_area

  iou = intersection_area / union_area
  return iou

def calculate_map(ground_truth, predictions, iou_threshold=0.5):
  """Calculates the mean Average Precision (mAP) for object detection.

  Args:
    ground_truth: A list of dictionaries, each representing ground truth data
                  for an image. Each dictionary should have the following keys:
                    'boxes': A list of bounding boxes, each in the format
                             [x_min, y_min, x_max, y_max].
                    'classes': A list of class labels corresponding to the boxes.
    predictions: A list of dictionaries, each representing predictions for an
                 image. Each dictionary should have the same format as
                 ground_truth, with an additional key:
                    'scores': A list of confidence scores for each predicted box.
    iou_threshold: The IoU threshold to consider a prediction as a true positive.

  Returns:
    mAP: The mean Average Precision, a float between 0 and 1.
  """

  all_classes = sorted(set(class_label
                           for image_data in ground_truth
                           for class_label in image_data['classes']))

  average_precisions = []
  for class_label in all_classes:
    y_true = []
    y_scores = []
    for gt_data, pred_data in zip(ground_truth, predictions):
      gt_boxes = np.array(gt_data['boxes'])
      gt_classes = np.array(gt_data['classes'])
      pred_boxes = np.array(pred_data['boxes'])
      pred_classes = np.array(pred_data['classes'])
      pred_scores = np.array(pred_data['scores'])

      # Filter predictions and ground truths for the current class
      relevant_gt_indices = np.where(gt_classes == class_label)[0]
      relevant_pred_indices = np.where(pred_classes == class_label)[0]

      if len(relevant_gt_indices) == 0:
        # No ground truth objects of this class in this image
        continue

      if len(relevant_pred_indices) == 0:
        # No predictions for this class in this image
        y_true.extend([0] * len(relevant_gt_indices))
        continue

      # Calculate IoUs between all relevant ground truth and predictions
      ious = np.zeros((len(relevant_gt_indices), len(relevant_pred_indices)))
      for i, gt_idx in enumerate(relevant_gt_indices):
        for j, pred_idx in enumerate(relevant_pred_indices):
          ious[i, j] = calculate_iou(gt_boxes[gt_idx], pred_boxes[pred_idx])

      # Assign predictions to ground truths based on IoU
      gt_matched = np.zeros(len(relevant_gt_indices), dtype=bool)
      for j, pred_idx in enumerate(relevant_pred_indices):
        best_iou = np.max(ious[:, j])
        best_iou_idx = np.argmax(ious[:, j])
        if best_iou >= iou_threshold and not gt_matched[best_iou_idx]:
          y_true.append(1)
          y_scores.append(pred_scores[pred_idx])
          gt_matched[best_iou_idx] = True
        else:
          y_true.append(0)
          y_scores.append(pred_scores[pred_idx])

    # Calculate AP for the current class
    if len(y_true) > 0:
      ap = average_precision_score(y_true, y_scores)
      average_precisions.append(ap)

  # Calculate mAP
  mAP = np.mean(average_precisions) if average_precisions else 0.0
  return mAP

# Example usage:
ground_truth = [
    {
        'boxes': [[50, 50, 100, 100], [150, 150, 200, 200]],
        'classes': [1, 2],  # Class labels (e.g., 1: 'cat', 2: 'dog')
    },
    # Add more image data here...
]

predictions = [
    {
        'boxes': [[45, 45, 95, 95], [140, 160, 210, 205]],
        'classes': [1, 2],
        'scores': [0.9, 0.8],  # Confidence scores for each prediction
    },
    # Add more image data here...
]

mAP = calculate_map(ground_truth, predictions)
print(f"mAP: {mAP:.4f}")
Explanation:
calculate_iou(box1, box2): This function calculates the IoU between two bounding boxes using the provided formula.calculate_map(ground_truth, predictions, iou_threshold=0.5):
sklearn.metrics.average_precision_score to calculate the area under the precision-recall curve (AP) for each class.Key Points:
This example provides a clear implementation of mAP calculation for object detection. Remember to adapt the data loading and preprocessing steps to your specific dataset and model outputs.
Understanding the Concepts:
Practical Considerations:
Beyond mAP:
In Summary:
mAP is a valuable metric for evaluating object detection models, but it's essential to understand its underlying concepts, limitations, and how it relates to your specific application's requirements.
This article provides a concise explanation of mean Average Precision (mAP), a key metric for evaluating object detection models.
Here's a breakdown:
Goal: mAP quantifies how well a model locates and classifies objects within images.
Foundation (IoU):
Determining Correct Predictions:
Precision and Recall:
Precision-Recall Curve:
Average Precision (AP):
Mean Average Precision (mAP):
In essence, mAP combines object localization accuracy (IoU) with classification performance (precision and recall) to provide a robust evaluation of object detection models.
In conclusion, mAP is a widely used metric for evaluating the performance of object detection models. It provides a single, comprehensive measure of a model's ability to correctly locate and classify objects within images, taking into account both localization accuracy (IoU) and classification performance (precision and recall). By averaging the area under the precision-recall curves across all object classes, mAP offers a balanced assessment of a model's overall accuracy. Understanding the components of mAP, including IoU, precision-recall curves, and AP, is crucial for interpreting model performance and comparing different object detection approaches. While mAP is a valuable tool, it's essential to consider its limitations and potential variations in calculation methods. Additionally, incorporating other metrics like frame rate and memory usage, along with qualitative analysis of model predictions, provides a more holistic evaluation of object detection models for specific applications.
 machine learning - What is the mAP metric and how is it calculated ... | Mar 29, 2016 ... In Computer Vision and Object Detection, a common evaluation method is mAP. What is it and how is it calculated?
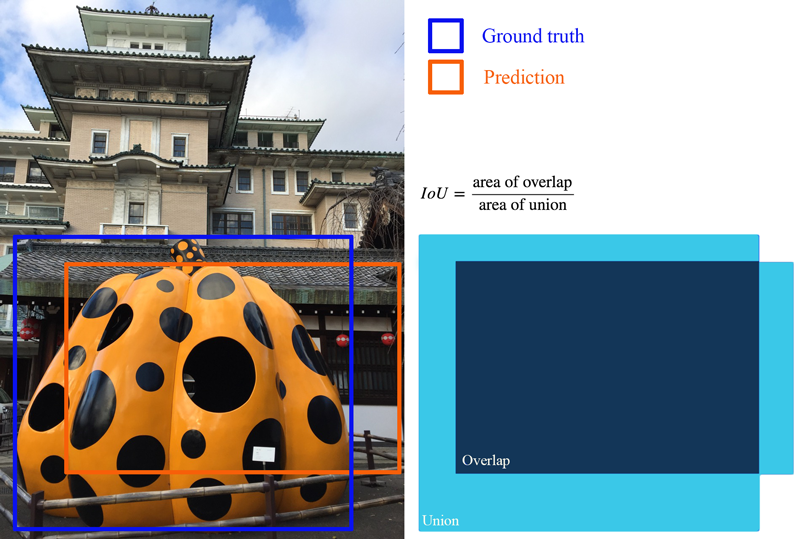 mAP (mean Average Precision) for Object Detection | by Jonathan ... | AP (Average precision) is a popular metric in measuring the accuracy of object detectors like Faster R-CNN, SSD, etc. Average precision…
 Mean Average Precision (mAP): An Essential Accuracy Metric ... | Want to ensure your algorithm for object detection performs well?
  Mean Average Precision (mAP) in Object Detection | Mean Average Precision (mAP) is a evaluation metric used for evaluating machine learning models. We have covered mAP object detection metric in detail COCO mAP
 Mean Average Precision (MAP) in ranking and recommendations | Mean Average Precision (MAP) is a metric that helps evaluate the quality of ranking and recommender systems. In this illustrated guide, we break it down in detail.
 YOLO Performance Metrics - Ultralytics YOLO Docs | Explore essential YOLO11 performance metrics like mAP, IoU, F1 Score, Precision, and Recall. Learn how to calculate and interpret them for model evaluation.
 What is Mean Average Precision (mAP) in Object Detection? | What is mean average precision? How do we calculate mAP?
 Calculate Metrics (Defense Mapping)—ArcMap | Documentation | Populates metrics for features in ArcGIS Defense Mapping data models. Metrics include length, width, area, and elevation attributes.
 3 Problems Solved by Adobe Analytics Calculated Metrics | What are calculated metrics? Find out and learn how to use them to fill data gaps, solve reporting problems using Adobe Analytics. See all data trends!