Machine Vision
OpenCV Rectangle Drawing: Define a Region
Learn how to use OpenCV's drawing functions to easily highlight regions of interest by drawing rectangles around them in images or video frames.
Learn how to use OpenCV's drawing functions to easily highlight regions of interest by drawing rectangles around them in images or video frames.

In this tutorial, we'll explore how to draw rectangles on images using the OpenCV library in Python. Whether you want to highlight specific areas of interest or create bounding boxes for object detection, OpenCV provides a simple and efficient way to achieve this. We'll walk through a step-by-step guide, explaining each part of the process.
Import the OpenCV library:
import cv2Load your image:
image = cv2.imread('your_image.jpg')Define the rectangle coordinates:
pt1: Top-left corner (x, y)pt2: Bottom-right corner (x, y)pt1 = (50, 50)
pt2 = (200, 150) Set the rectangle's color and thickness:
color: (B, G, R) tuple, e.g., (255, 0, 0) for bluethickness: Line thickness in pixels (negative for filled rectangle)color = (0, 255, 0) # Green
thickness = 2Draw the rectangle on the image:
cv2.rectangle(image, pt1, pt2, color, thickness)Display the image (optional):
cv2.imshow('Image with Rectangle', image)
cv2.waitKey(0)
cv2.destroyAllWindows()To draw a rectangle around a specific region of interest, you'll need to first identify that region. This might involve techniques like:
Once you have the coordinates of the region, you can use the cv2.rectangle() function as described above.
This Python code uses the OpenCV library to draw a green rectangle on an image. It loads an image from a file, defines the top-left and bottom-right corners of the rectangle, sets the color and thickness of the rectangle, draws the rectangle on the image using the cv2.rectangle() function, and finally displays the image with the rectangle.
import cv2
# Load the image
image = cv2.imread('your_image.jpg')
# Define rectangle coordinates (top-left and bottom-right)
pt1 = (50, 50)
pt2 = (200, 150)
# Set rectangle color (green) and thickness
color = (0, 255, 0)
thickness = 2
# Draw the rectangle on the image
cv2.rectangle(image, pt1, pt2, color, thickness)
# Display the image with the rectangle
cv2.imshow('Image with Rectangle', image)
cv2.waitKey(0)
cv2.destroyAllWindows()Example: Drawing a rectangle around a detected face
import cv2

# Load the face detection model
face_cascade = cv2.CascadeClassifier(cv2.data.haarcascades + 'haarcascade_frontalface_default.xml')

# Load the image
image = cv2.imread('face_image.jpg')
gray = cv2.cvtColor(image, cv2.COLOR_BGR2GRAY)

# Detect faces
faces = face_cascade.detectMultiScale(gray, 1.3, 5)

# Draw a rectangle around each detected face
for (x, y, w, h) in faces:
    cv2.rectangle(image, (x, y), (x+w, y+h), (255, 0, 0), 2)

# Display the image with detected faces
cv2.imshow('Image with Faces Detected', image)
cv2.waitKey(0)
cv2.destroyAllWindows()
Explanation:
import cv2
image = cv2.imread('your_image.jpg')
pt1 = (50, 50), pt2 = (200, 150) (adjust coordinates as needed)color = (0, 255, 0) (green), thickness = 2
cv2.rectangle(image, pt1, pt2, color, thickness)
cv2.imshow(...), cv2.waitKey(0), cv2.destroyAllWindows()
In the face detection example, we first load a pre-trained face detection model. Then, we detect faces in the image and get their coordinates. Finally, we use these coordinates to draw rectangles around the detected faces.
Remember to replace 'your_image.jpg' and 'face_image.jpg' with the actual paths to your image files.
General:
cv2.rectangle() directly modifies the original image. If you need to preserve the original, create a copy first using image.copy().Rectangle Parameters:
thickness > 0: Specifies line thickness in pixels.thickness = -1 or cv2.FILLED: Fills the rectangle completely.cv2.cvtColor().Region of Interest (ROI) Selection:
Beyond Basic Rectangles:
cv2.rectangle(), you can achieve rounded corners by drawing a filled contour of a rounded rectangle shape.Debugging Tips:
pt1 and pt2 coordinates to verify they correspond to the intended region on the image.cv2.imshow() to display intermediate image processing results (e.g., after color thresholding) to ensure your ROI selection is working as expected.This guide summarizes how to draw rectangles on images using the OpenCV library in Python.
Steps:
import cv2
image = cv2.imread('your_image.jpg')
pt1 = (x1, y1) (top-left corner)pt2 = (x2, y2) (bottom-right corner)color = (B, G, R) (e.g., (0, 255, 0) for green)thickness = integer (negative value fills the rectangle)cv2.rectangle(image, pt1, pt2, color, thickness)
cv2.imshow('Image with Rectangle', image)cv2.waitKey(0)cv2.destroyAllWindows()Drawing Rectangles Around Regions of Interest:
To draw rectangles around specific areas, you need to identify those regions first. Techniques for doing so include:
Once you have the region's coordinates, use cv2.rectangle() to draw the rectangle.
Drawing rectangles on images is a fundamental operation in computer vision, often used for highlighting regions of interest or bounding boxes around detected objects. OpenCV, a powerful computer vision library, provides the tools to easily accomplish this task using Python. By understanding the basic steps of loading an image, defining rectangle coordinates, setting color and thickness, and using the cv2.rectangle() function, you can start marking up images for various purposes. Whether you're building object detection systems, image annotation tools, or simply experimenting with image manipulation, mastering the art of drawing rectangles with OpenCV is a valuable skill in any computer vision enthusiast's toolkit.
 Drawing a rectangle around the red color region - OpenCV Q&A ... | Apr 28, 2024 ... Hi. I am trying to draw a rectangle around the biggest red color region in the image. import cv2 import numpy as np img ...
 opencv - How to draw rectangle around object using features (ORB ... | Mar 17, 2017 ... If I can calculate how dense they are, (probably the area around 'Black car' has the highest density..?) then I can draw rectangle more easily.
 How to draw a rectangle around a region of interest in Python ... | Nov 1, 2021 ... How do you draw a rectangle around a region of interest in Python (Python, OpenCV, computer vision, draw, development)?. All related (27). opencv - How can I draw a rectangle around a colored object in ... | Nov 30, 2017 ... Like Tiphel said, you can use cv2.findContours and cv2.drawContours. Alternatively, after getting the contours, you can draw a box using cv2 ...
 Finding blocks of text in an image using Python, OpenCV and numpy | Jan 7, 2015 ... The areas around the borders will be mostly black, so the rank ... # draw rectangle around contour on original image cv2.rectangle ... python - Specifying a rectangle around a binary object to define a ... | Mar 4, 2018 ... OpenCV: draw a rectangle around a region · 0 · How can I draw a ... Identifying multiple rectangles and draw bounding box around them using OpenCV.
 Extracting small images from a large tif file - Python - OpenCV | Hello, I need to take/extract small images from a big .tif file. Suppose I have a big .tif file gathered from a UAV depicting houses. I need to gather every house from the .tif image and store them as .jpeg files, → house_1.jpeg, house_2.jpeg etc.? Is there any fast way?? I will define the crop area around the house. I don’t want to use MSpaint it is very time consuming… Thanks!!
 SolvePnP seems......sensitive - Programming - Chief Delphi | It’s the off season, and we’re trying to get things done that didn’t happen during the regular season. High on my list is improving autonomous programming and computer vision. We’re using OpenCV on a Jevois camera. My main task right now is to use the vision targets to guide the robot to the right spot to place hatch panels. Fairly straightforward. Lots of teams have done it, and yet we didn’t get it done this season. There are a few ways to approach this task, but here’s the one I chose: ...
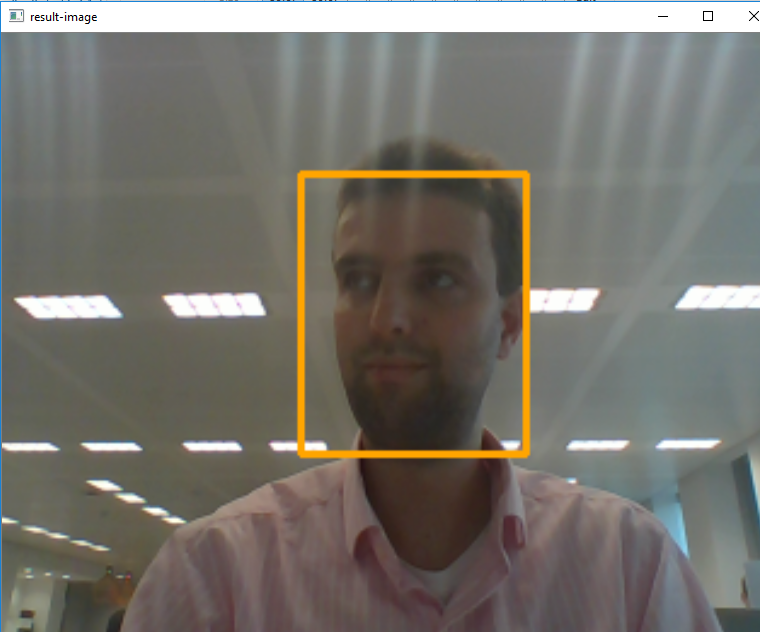 Detecting and tracking a face with Python and OpenCV | At work, I was asked whether I wanted to help out on a project dealing with a robot that could do autonomous navigation and combine this with both speech recognition and most importantly: face recognition. The moment I heard about this project, I knew I wanted to be involved :) During