Python
Python Plot Legend Outside: A Step-by-Step Guide
Learn different methods to effortlessly position your plot's legend outside the plotting area in Python for enhanced readability and aesthetic appeal.
Learn different methods to effortlessly position your plot's legend outside the plotting area in Python for enhanced readability and aesthetic appeal.

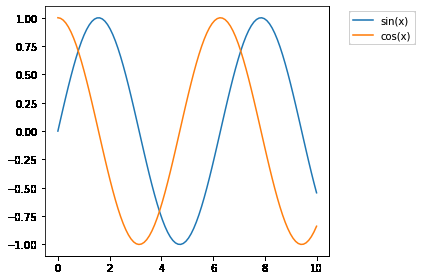
In this tutorial, we'll learn how to place the legend outside of a Matplotlib plot in Python. This is particularly useful when the legend overlaps with the plot elements, making it difficult to read. We'll use the matplotlib.pyplot module for this purpose.
Import the necessary library:
import matplotlib.pyplot as pltCreate your plot:
plt.plot([1, 2, 3, 4], [10, 20, 25, 30], label='Line 1')
plt.plot([1, 2, 3, 4], [15, 25, 30, 35], label='Line 2')
Use the plt.legend() function with the bbox_to_anchor parameter:
To place the legend outside the plot:
plt.legend(bbox_to_anchor=(1.05, 1), loc='upper left')bbox_to_anchor=(1.05, 1) places the legend slightly to the right (1.05) and at the top (1) of the plot.loc='upper left' specifies the upper left corner of the legend box as the anchor point.To adjust the legend's position further:
bbox_to_anchor to move the legend further to the right.bbox_to_anchor to move the legend below the plot.To prevent the legend from overlapping with the plot:
plt.tight_layout()Display the plot:
plt.show()The Python code generates a line plot with two lines, 'Line 1' and 'Line 2', with specified x and y values. The legend is positioned outside the plot on the right side and the layout is adjusted to prevent overlapping of plot elements. Finally, the plot is displayed.
import matplotlib.pyplot as plt

# Create your plot
plt.plot([1, 2, 3, 4], [10, 20, 25, 30], label='Line 1')
plt.plot([1, 2, 3, 4], [15, 25, 30, 35], label='Line 2')

# Place the legend outside the plot
plt.legend(bbox_to_anchor=(1.05, 1), loc='upper left')

# Prevent the legend from overlapping with the plot
plt.tight_layout()

# Display the plot
plt.show()
Explanation:
matplotlib.pyplot: This line imports the necessary library for plotting.plt.plot([1, 2, 3, 4], [10, 20, 25, 30], label='Line 1'): Plots the first line with x-values [1, 2, 3, 4] and corresponding y-values [10, 20, 25, 30]. The label argument sets the label for this line in the legend.plt.plot([1, 2, 3, 4], [15, 25, 30, 35], label='Line 2'): Plots the second line similarly.plt.legend(bbox_to_anchor=(1.05, 1), loc='upper left'):
bbox_to_anchor=(1.05, 1): Specifies the coordinates (1.05, 1) relative to the plot's coordinate system (where (0, 0) is the bottom left and (1, 1) is the top right) for placing the legend box.loc='upper left': Sets the upper left corner of the legend box as the anchor point for the specified bbox_to_anchor coordinates.plt.tight_layout(): Adjusts the plot's layout to prevent labels, titles, and the legend from overlapping with the plot area.plt.show(): Shows the plot with the legend placed outside.This code will create a plot with two lines and a legend positioned slightly to the right and at the top of the plot area, ensuring no overlapping occurs.
bbox_to_anchor: The bbox_to_anchor parameter is very versatile. You can:
loc values to control which corner of the legend box is anchored to the specified coordinates.bbox_to_anchor to achieve the desired legend placement, especially for complex plots.bbox_to_anchor is powerful, consider these alternatives for simpler cases:
plt.legend() accepts keywords like 'upper right', 'lower left', etc., for common legend placements.plt.legend(fontsize='small').plt.tight_layout() importance: Always use plt.tight_layout() after placing the legend outside to prevent overlapping and ensure all elements fit within the figure.plt.savefig('my_plot.png') to save it as an image file. Make sure to call plt.tight_layout() before saving to avoid cropping issues.Refer to the Matplotlib documentation for more details on these customizations and other legend options.
This guide explains how to move the legend outside of a Matplotlib plot in Python.
Key Steps:
matplotlib.pyplot: import matplotlib.pyplot as plt
plt.plot() to define your lines and labels.plt.legend(bbox_to_anchor=(x, y), loc='position')
bbox_to_anchor: Controls legend position relative to the plot.
x > 1: Moves legend to the right.y < 1: Moves legend below the plot.loc: Specifies the anchor point within the legend box (e.g., 'upper left').plt.tight_layout() to adjust plot elements and avoid overlap.plt.show()
Example:
import matplotlib.pyplot as plt

plt.plot([1, 2, 3, 4], [10, 20, 25, 30], label='Line 1')
plt.plot([1, 2, 3, 4], [15, 25, 30, 35], label='Line 2')

plt.legend(bbox_to_anchor=(1.05, 1), loc='upper left')
plt.tight_layout()
plt.show()
This code creates a plot with two lines and places the legend slightly to the right and at the top, preventing any overlap with the plotted data.
This guide provided a comprehensive overview of positioning legends outside a Matplotlib plot. We covered the importance of using bbox_to_anchor and loc for precise placement, and how plt.tight_layout() ensures a polished look by preventing overlaps. Remember that Matplotlib offers extensive customization options, so explore its documentation to tailor your plots further. By mastering these techniques, you'll enhance the clarity and visual appeal of your data visualizations.
 How to Place Legend Outside of the Plot in Matplotlib ... | A Computer Science portal for geeks. It contains well written, well thought and well explained computer science and programming articles, quizzes and practice/competitive programming/company interview Questions.
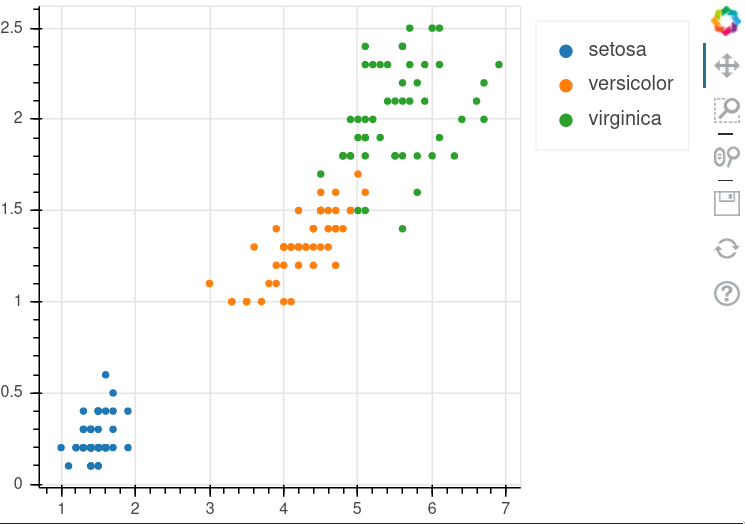 Adding a legend outside the plot area is possible even with auto ... | I thought that it was not possible to add a legend outside of the plot area unless the legend is created directly (as stated in the docs). However, I just discovered that it is: from bokeh.models import CategoricalColorMapper, Legend from bokeh.palettes import Category10 from bokeh.plotting import figure, show from bokeh.sampledata.iris import flowers color_mapper = CategoricalColorMapper( factors=[x for x in flowers['species'].unique()], palette=Category10[10]) p = figure(height=350, wid...
 How to Place the Legend Outside the Plot in Matplotlib | Built In | When plotting figures with Matplotlib, learn how you can place the legend of a figure outside of the plot area.
 Legend outside plot when legend not directly created - Community ... | Hello! I have a plot I’m fairly happy with. But I’d like the legend to be located outside the plot area. The documentation says that " To position a legend outside the central area, use the add_layout method of a plot. This requires creating the Legend object directly". The reason I have not created the legend directly, e.g., legend = Legend(items=('var1',[var1]), is that the exact variables (number of them and the content) change. I’m creating the plot by: for i in range(0, N_sites): ...
 Enhancing Data Visualization: Moving Legends Outside the Plot ... | Python's Matplotlib is a powerful tool for data visualization. One common requirement is to place the legend outside the plot. This blog post will guide you through the process, step by step.
 Making Plots place its legend in a better spot - Visualization - Julia ... | Apparently this is a feature, or not of the backend, and Plots sends legend=:best to them. PyPlot should place the legend in a nice position by default, avoiding the data, but GR apparently does not have this feature. I think that is a sensible issue to open as a feature request (or just implement that, if anyone has any clue on how to do it).