Python
Matplotlib Figure Size: A Quick Guide to Resizing Plots
Learn various methods, including DPI settings and figure size arguments, to effectively adjust the size of figures generated using Matplotlib in Python.
Learn various methods, including DPI settings and figure size arguments, to effectively adjust the size of figures generated using Matplotlib in Python.

When using Matplotlib in Python, you might want to adjust the size of your figures to fit your needs, whether it's for presentations, reports, or any other purpose. This article will guide you on how to easily control the size of your Matplotlib figures using the figsize parameter.
To control the size of your Matplotlib figures in Python, use the figsize parameter. Here's how:
Import the necessary library:
import matplotlib.pyplot as pltCreate your plot:
plt.plot([1, 2, 3, 4], [10, 20, 25, 30]) Specify the figure size using figsize:
plt.figure(figsize=(8, 6)) # Creates a figure 8 inches wide and 6 inches tallplt.plot() in this example).figsize argument takes a tuple: (width, height).Display your plot:
plt.show()Now, your plot will appear with the specified dimensions.
The Python code uses the matplotlib library to create a simple line plot. It defines data points for x and y axes, sets the figure size to 8 inches wide and 6 inches tall, plots the data, and then displays the plot.
import matplotlib.pyplot as plt

# Create data for the plot
x = [1, 2, 3, 4]
y = [10, 20, 25, 30]

# Specify the figure size using figsize
plt.figure(figsize=(8, 6))  # Creates a figure 8 inches wide and 6 inches tall

# Create the plot
plt.plot(x, y)

# Display the plot
plt.show()figsize only affects the figure it's called upon. Subsequent figures will revert to default sizes unless you set figsize again.plt.figure(): You can create a figure and axes object directly using fig, ax = plt.subplots(figsize=(8, 6)). This combines figure creation and size setting in one step.figsize affects the aspect ratio of your plot. Be mindful of this, especially if your visualization relies on accurate proportions.figsize controls the physical dimensions of the figure, while resolution (DPI) determines the number of pixels per inch. Adjust resolution separately if needed.plt.savefig(), the figsize you set will determine the dimensions of the saved image file.| Feature | Description |
|---|---|
| Library |
matplotlib.pyplot (imported as plt) |
| Figure Size Control | plt.figure(figsize=(width, height)) |
| Units | Inches |
| Placement | Before plotting code (e.g., plt.plot()) |
| Example |
plt.figure(figsize=(8, 6)) creates a figure 8 inches wide and 6 inches tall. |
Mastering figure sizing in Matplotlib gives you greater control over the visual presentation of your data. Whether you're creating plots for publications, presentations, or simply want to fine-tune their appearance, the figsize parameter is an essential tool in your Matplotlib toolkit. Remember to adjust figure size contextually, considering the specific requirements of your output and the audience for your visualizations.
 How to change the size of figures drawn with matplotlib ... | A Computer Science portal for geeks. It contains well written, well thought and well explained computer science and programming articles, quizzes and practice/competitive programming/company interview Questions.
 Change the size of figures drawn with Matplotlib in Python | Sentry | The Problem How do I change the size of figures drawn with Matplotlib in Python? The Solution To set the size of a new figure on creation, you can provide the…
 python - Change figure size and figure format in matplotlib - Stack ... | Jun 14, 2013 ... You can set the figure size if you explicitly create the figure with plt.figure(figsize=(3,4)). You need to set figure size before calling ...
 How Do I Change the Figure Size of Figures Drawn With Matplotlib ... | The Matplotlib library provides a lot of flexibility in creating graphs and designs. It allows you to control every aspect of the visual you create. An
 matplotlib.figure — Matplotlib 3.9.2 documentation | Return the figure's background patch visibility, i.e. whether the figure background will be drawn. Figure.set_linewidth. Set the line width of the Figure ...
 Here is how to change the size of figures drawn with Matplotlib in ... | To change the size of a figure drawn with Matplotlib, you can use the figure() function and specify the figsize parameter. This parameter takes a tuple of ( ...
 Plots.jl set figure size for LaTeX publications - Visualization - Julia ... | Hi, I want to use Plots.jl to make figures for a publication. I want the width of the figure to be exactly 246.0 points (pt). The format should be pdf. I want to do this, so I can import the pdf figure into LaTeX later and have the fonts appearing the same as set for plotting. I come from pyplot and there you can convert to inches and then set the size of the resulting figure. As far as I am aware of Plots.jl only lets you specifiy the size in pixels. I found Use Measure when setting plot siz...
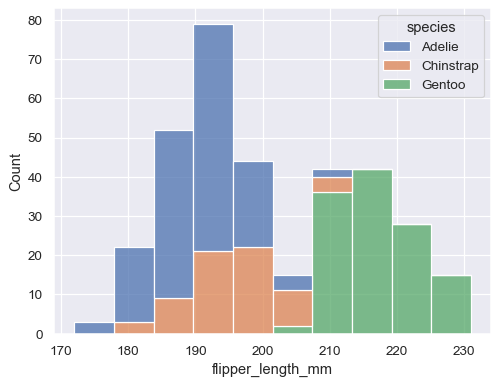 Overview of seaborn plotting functions — seaborn 0.13.2 ... | Specifying figure sizes#. To increase or decrease the size of a matplotlib plot, you set the width and height of the entire figure, either in the global ...
 Figures – Quarto | You can change the display size by adding the width and height attributes to the figure. ... matplotlib.pyplot as plt plt.plot([1,23,2,4]) plt.show ...